

These Are the Charts That Scare Wall Street
Forget scary clowns
For finance professionals, Corporate America’s credit cycle and the U.S. economic outlook — not to mention Brexit-induced stresses and debt dynamics in Asia — are all spookier than a deranged-looking Bozo.
With Halloween just around the corner, we asked top analysts around the world for charts about things that go bump in the night — and we’re not just talking about the daily yuan fix. Here’s what they said scares them.
Full story on Bloomberg.com
In this scary story find out that…
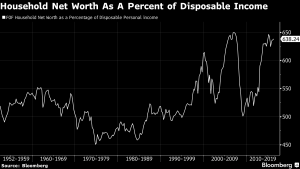
- Wealth to income is near an all-time record high
- A rise in delinquency rates for commercial and industrial loans has previously preceded recessions
- We are investing less than four cents of every dollar we earn back into our nation’s productive capacity
- With profit growth contracting over the last year, business cash flow concerns have increased
- Leverage in the Chinese economy in general is high … the impact on debt markets in general could be very negative
- Wage growth accelerating … suggesting we are nearing an overheating (and an unfriendly, more aggressive policy response)
- the Fed doesn’t seem particularly worried about financial stability
- the CPI medical care index … now growing at almost a 5 percent rate
- real estate near its highest-ever share of the economy
- in May 2013 Treasury VIX was about where it is today and the 10-year yield was 1.76 percent
- …and many more
Money Questioner’s thoughts
Bloomberg has done well to compile this list, sourced from economists around the industry. Of course, one chart doesn’t make a prediction, but when a number of them line up together perhaps we need to heed the warning signs?
I would be concerned about land (real estate) prices and low yields. But the next shock to the economy is probably going to be caused by something we haven’t yet thought about, because there’s no chart for it. Yet.


